Predictive Modeling of Alzheimer’s Outcomes
Could we identify individuals at risk of developing Alzheimer’s?
When deciding on a project proposal, I was looking at datasets relating to the brain and found one on Alzheimer’s. Because Alzheimer’s Disease remains a significant challenge in the modern age, the choice was obvious.
What is Alzheimer’s Disease?
Alzheimer’s Disease (AD) is a neurodegenerative disorder characterized by significant cognitive decline. It is the most common form of dementia, accounting for more than 70% of all cases worldwide, and the number of cases is expected to rise in the near future. Before developing AD, individuals first undergo mild cognitive impairment (MCI), a condition where cognitive issues emerge but are not severe enough to disrupt daily life. Not everyone with MCI will progress to AD, but currently it is difficult to identify the individuals that will. Additionally, treatment options are available for early-to-mid stage AD yet over half of people are diagnosed at a more advanced stage. Thus, I aimed to classify MCI patients from AD patients and predict who will progress to AD at 1yr, 3yr and 5y intervals.
Dataset Overview
For my project, I used the Alzheimer’s Disease Neuroimaging Initiative (ADNI), a comprehensive longitudinal study that contains clinical, imaging, demographic, and biomarker information. Below are the features that I selected which are all relevant to AD.
| Feature | Category | Description |
|---|---|---|
| Sex | Demographic | Participant's Sex |
| Race | Demographic | Participant's Race |
| Ethnicity | Demographic | Participant's Ethnicity |
| Depression | Clinical | Has Depression |
| Abnormal Cholesterol | Clinical | Has abnormal cholesterol levels |
| Hypertension | Clinical | Has hypertension |
| Fusiform | Biomarker | Fusiform gyrus volume |
| Hippocampus | Biomarker | Hippocampal volume |
| BMI | Biomarker | Body Mass Index |
| Ravlt Percent Forgetting | Neuropsychological Assessments | Indicator of memory dysfunction |
| Education_level | Neuropsychological Assessments | Years of education |
| ADAS13 | Neuropsychological Assessments | 13-item Alzheimer's Disease Assessment Scale |
| FAQ | Neuropsychological Assessments | Functional Assessment Questionnaire |
| Ravlt Immediate | Neuropsychological Assessments | Assesses immediate memory |
| Ravlt Learning | Neuropsychological Assessments | Assesses verbal learning |
| Age | Demographic | Participant's age |
| Entorhinal | Biomarker | Entorhinal volume |
| Midtemp | Biomarker | Midtemporal gyrus volume |
| APOE4 copy number | Biomarker | Number of APOE4 copies |
| ADAS11 | Neuropsychological Assessments | 11-item Alzheimer's Disease Assessment Scale |
| ADASQ4 | Neuropsychological Assessments | Task 4 of the Alzheimer's Disease Assessment Scale |
I do want to point out that I used only the features taken at baseline which is around the time a participant enrolled in the study for all the models. I also excluded any variables that were used for the inclusion criteria, which would have affected the classification results.
EDA
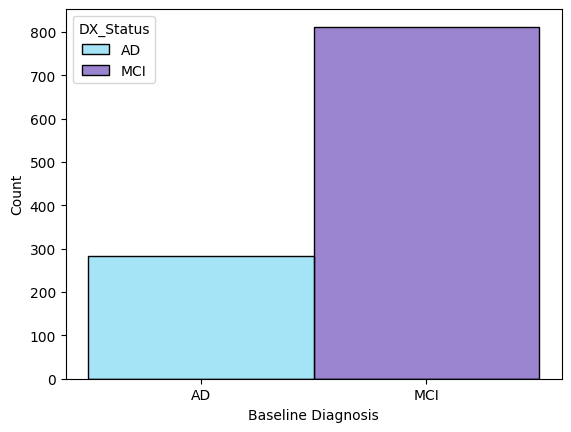
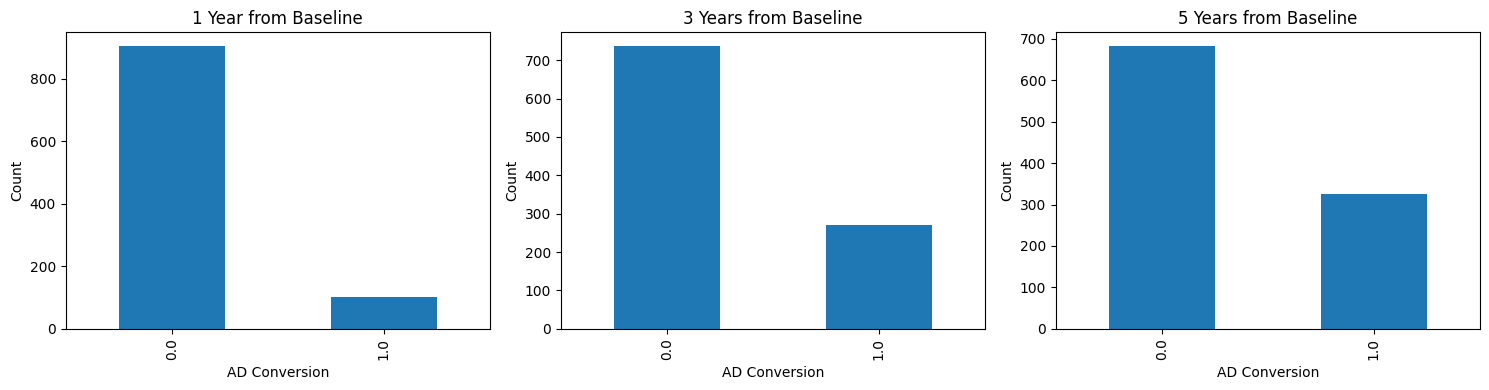
Early exploration centered on the practical constraints of the dataset which were primarily class imbalance and missing values. The class distribution at baseline had a modest 3:1 ratio of AD vs MCI participants while the ratio of non-converters vs converters within one year from baseline were 9:1. I won’t get into the distribution of the features here but race, ethnicity, and clinical history of depression were noticeably skewed.
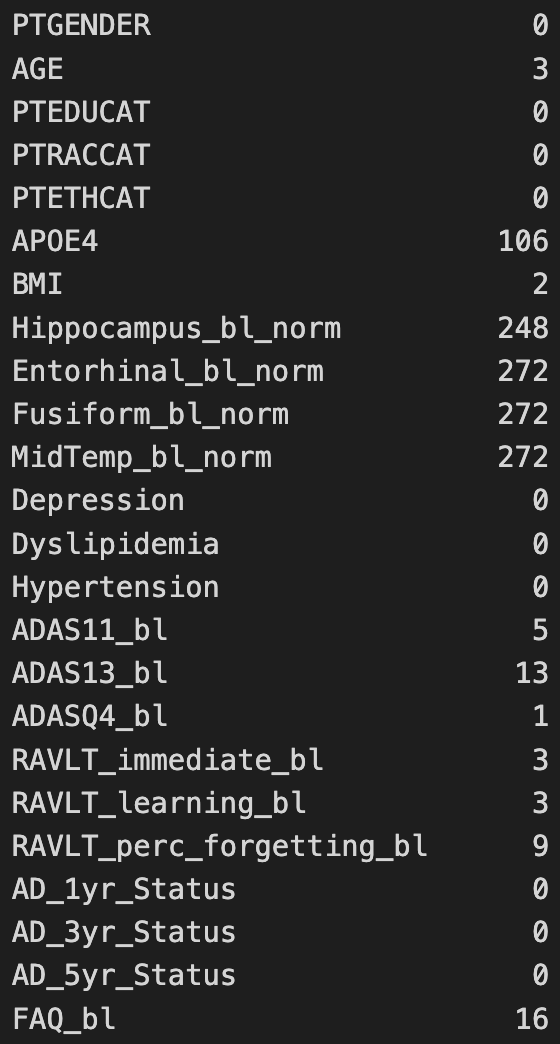 The features that contained the most missing values were the MRI-derived brain measurements followed by the APOE4 copy number.
Feature Preparation and Engineering
While most features were used as-is, others were derived from the raw data. BMI was calculated using metric units after converting weight and height from pounds and inches if they weren’t already in metric units. Clinical features were extracted from the participants’ clinical history. Regional brain volumes for each subject were normalized using their respective intracranial volume. I also performed QC and found some outrageous BMI values (100+) so I removed them. Finally, I searched for the Alzheimer’s status for participants at the different time windows to identify the converters. For feature engineering, I encoded the categorical features as numeric arrays and performed feature scaling. Missing values were either dropped or imputed.
Models Used and Metrics
The models that I used were random forest, logistic regression, and support vector machine for their strengths in classification tasks. 5-fold cross-validation was used to evaluate performance. I used the F1-Score, average-precision and accuracy to compare the models. The training and testing split was 70%/30%.
Results
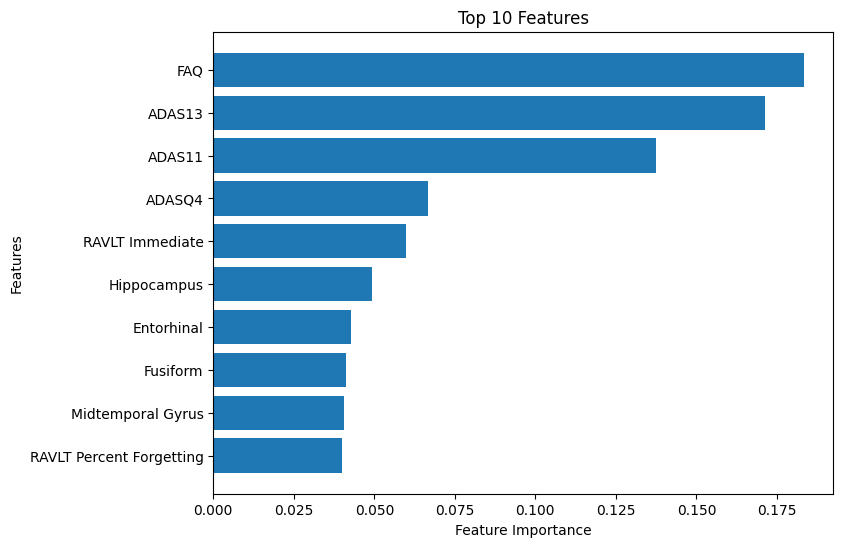
For baseline classification, the models performed similarly. Imputing the values did not affect performance. Using all the features, the Random Forest classifier had an accuracy of 87%, an F1-score of 74% and an average-precision score of 85%. Here, the top 10 features were shown to be brain measurements and neuropsychological assessments.
I also tested the three models using the top 10 features and then the top 3. The logistic regression model trained on three features had the best performance , with an accuracy of 0.88, F1-score of 0.76 and an average-precision of 0.87.
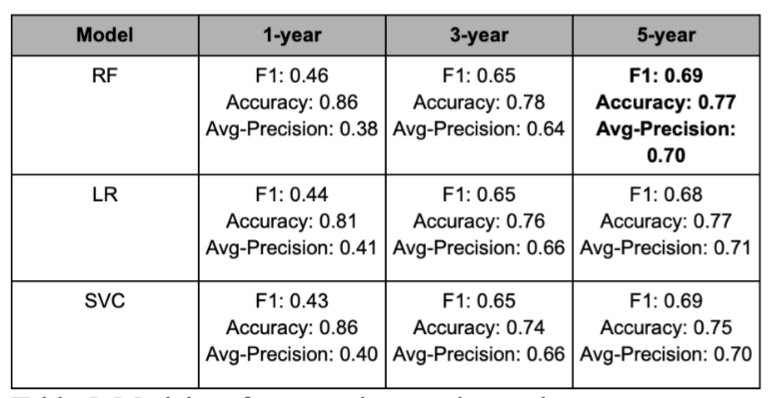
Predicting AD progression was much more difficult. Notice that the performance was worst when predicting conversion at year 1. The performance improved at year 3 and was even better at year 5, which led me thinking that the class imbalance was the likely cause, even when SMOTE and imputing were implemented
Conclusions
This project explored AD conversion using baseline classification and predictive modeling. Baseline classification highlighted differences between the MCI and AD subgroups and predictive modeling suggested which features might help identify high-risk MCI participants. Brain volume and measurements and especially neuropsychological assessments taken at baseline were found to have contributed the most to the model’s performance.
After Thoughts
This was the first time that I worked on a real-world clinical dataset. Here, I defined cohorts, created variables and applied and evaluated ML models for classification tasks. I spent most of my time reading on ADNI, the changes it had undergone for each phase and how the data was obtained and standardized.
While I didn't discover anything groundbreaking, I'm happy to report that my results were comparable to those found in the literature 🥳. Honestly, I wish I had done more given the rich data, but I had less than a semester and overall I'm pretty satisfied on how things went. I also enjoyed learning more about Alzheimer's (putting that neuroscience major to good use).
One last thing, I will not share my code as it contains private data and I used Jupyter Notebooks which shows snippets of the raw data (main reason why I decided on this write-up).
References
[1] World Health Organization. (n.d.). Dementia. World Health Organization. https://www.who.int/news-room/fact-sheets/detail/dementia [2] Centers for Disease Control and Prevention. (n.d.). About dementia. Centers for Disease Control and Prevention. https://www.cdc.gov/alzheimers-dementia/about/index.html [3] Alzheimer’s Association. (2025). 2025 Alzheimer’s disease facts and figures. Alzheimer’s & Dementia, 21(5) https://www.alz.org/getmedia/ef8f48f9-ad36-48ea-87f9-b74034635c1e/alzheimers-facts-and-figures.pdf [4] Ward, A., Tardiff, S., Dye, C., & Arrighi, H. M. (2013). Rate of conversion from prodromal Alzheimer’s disease to Alzheimer’s dementia: a systematic review of the literature. Dementia and geriatric cognitive disorders extra, 3(1), 320-332. [5] Serrano-Pozo, A., Frosch, M. P., Masliah, E., & Hyman, B. T. (2011). Neuropathological alterations in Alzheimer disease. Cold Spring Harbor perspectives in medicine, 1(1), a006189. [6] DeTure, M. A., & Dickson, D. W. (2019). The neuropathological diagnosis of Alzheimer’s disease. Molecular neurodegeneration, 14(1), 32.